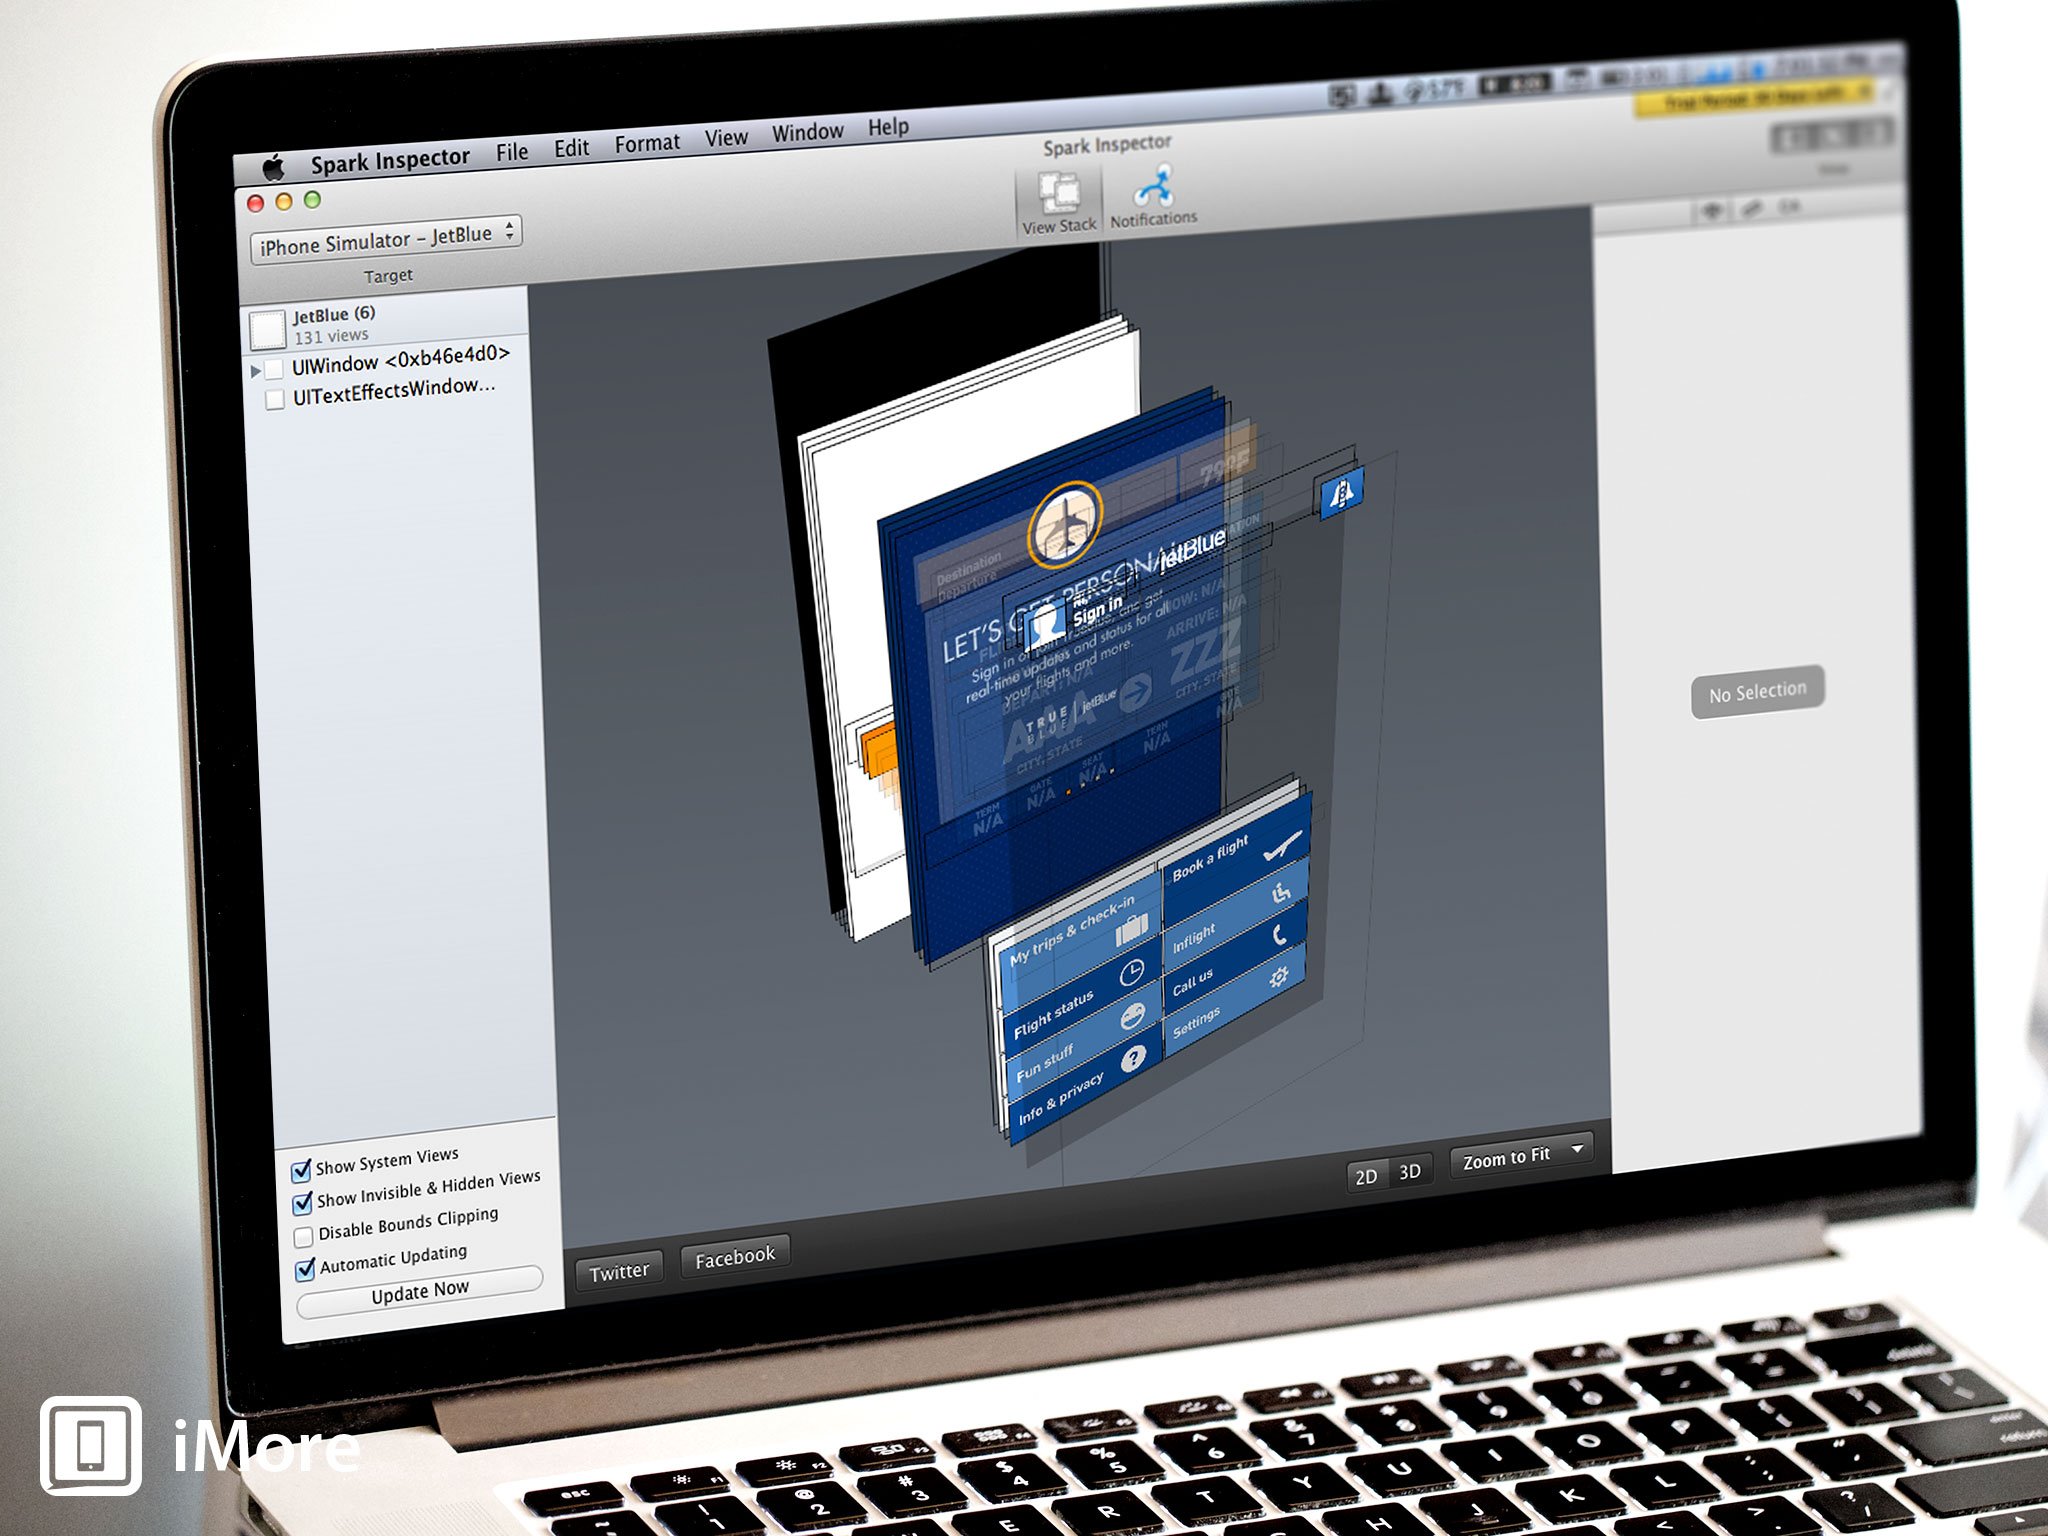
Spark Inspector, by Foundry376 and J. Benjamin Gotow, brings a new approach to debugging, offering developers the ability to view their apps in an exploded 3D model, as well as change characteristics of elements on the fly, without the need to recompile. Often times apps appear to be relatively flat, two-dimensional beings. After all, they are displayed on a flat glass screen. However, developers and designers (as well as many users) are well aware that apps are made up of a series of layers, with many elements changing states, hiding some layers while revealing others. This can make it difficult to understand how an app is composed and what elements you’re interacting with, even for developers.
The setup for Spark Inspector is extremely simple. When you launch the application you are greeted with a Setup Assistant. Just point Spark Inspector to your project and it makes the necessary changes to your app delegate and project file to link to the Spark framework. Should this automated process encounter any problems, Spark Inspector also provides framework setup instructions that you can perform manually, though in my testing it just worked.
Once the framework is setup, you’re free to build your project in Xcode, either to the simulator or a device, and Spark Inspector will hook in as soon as the build succeeds. Spark Inspector’s main pane will now show your app, possibly with some translucent layers depending how your view is set up. Moving to the cool part of this application, click on your app in Spark Inspector and drag it around to see an exploded 3D model of your app, showing the layers of all your views, labels, buttons and other UI elements. This gives you an immediate understanding of how your views are being composed. With its Notifications view, Spark Inspector also offers some under-the-cover insights, providing realtime information on the NSNotifications flying around inside your app.
Spark Inspector promises an entirely new debugging perspective, and I think it delivers there. It remains to be seen exactly how useful this new perspective will be.
An interesting option is the “Disable Bounds Clipping” option in the lower-left pane. If you have an app that builds a lot of content offscreen, unchecking this option gives insight into how such views are being built. Pull-to-refresh bars above the view, table cells from below the view, or carousel images to the left and right of the view; you’ll be able to see all of them as they’re created allowing you to better understand how offscreen rendering might be impacting your app’s performance.
As you click on each element, you’ll see two areas of Spark Inspector change. The left pane displays a hierarchy of all of the elements in the current view with the element you’ve just clicked selected. The right side hosts an inspector pane that displays the details of the element you have selected. Depending on the element you have selected, you can change and manipulate various characteristics, like a string’s value or the asset used on a button, and immediately see the changes on your device or simulator. Jumping around to different elements, I quickly noticed it can be quite difficult to select the element you’re trying for. As fun as it was to look at the 3D model, the easiest and least frustrating way to select elements was by using the hierarchy pane on the left.
Spark Inspector uses Bonjour the communicate between itself and your app. In an environment where you share a network with others, this can make things convenient or a hassle. When I start an application in my simulator, a co-worker can open Spark Inspector on their machine and connect it to my app without any additional steps. Although without any sort of passcode or password protection, it also means anybody on your network running Spark Inspector can see and make changes to an app you’re running. If you have confidential projects or just a meddlesome co-worker, this may prove problematic for you.
If you’re left unsure if Spark Inspector would be useful to you or not, you’re not alone, but Spark Inspector’s free trial certainly means it’s worth checking out.
As I tapped around apps in the simulator, I was impressed with Spark Inspector’s ability to keep up. As expected, there was some lag, but given what it was trying to display, it did a decent job keeping up... except when it didn’t. I kept running into issues where Spark Inspector just stopped updating for no apparent reason. I would drill down into a view, then back out, and Spark Inspector would be stuck on the view I had just left. On a number of occasions I was greeted with a lot (like a lot) of alert dialogs that said Bad Data. They instructed me to check and make sure I was running the latest version of the framework, which I was, but beyond that didn’t really give me any idea of how to fix the problem or avoid getting any more of these little gems. After dismissing the myriad of alerts, I had to stop my app in Xcode and restart it in order for Spark Inspector to start working again. Needless to say, this got a little frustrating after the 3rd or 4th time.
Admittedly, I may have been jumping around in the app more than Spark Inspector intends its users to. Another hint at this is that any changes made to elements will not persist when changing views. When changing elements like UI labels, navigating to another view and back meant those changes were lost. In fact, for views that update on a timer, like many data-driven apps, it appears that every time the view updates, you will lose any changes you made. This can be especially frustrating if your app has a particularly aggressive refresh strategy.
As the novelty of the 3D view wore off a bit and the bugginess started to set in, I actually started to wonder just how useful this application was going to be. It’s a cool looking application for sure. The website claims that Spark Inspector promises an entirely new debugging perspective, and I think it delivers there. It remains to be seen exactly how useful this new perspective will be. Not to mention that the types of methods that were likely employed to achieve the functionality in Spark Inspector come with an inherent unpredictability and instability that will likely result in a perpetually buggy experience.
If you’re left unsure if Spark Inspector would be useful to you or not, you’re not alone, but Spark Inspector’s free trial certainly means it’s worth checking out. The $24.99 price tag is reasonable for any developers who find the application useful in their workflow.
- $24.99 - Download now
